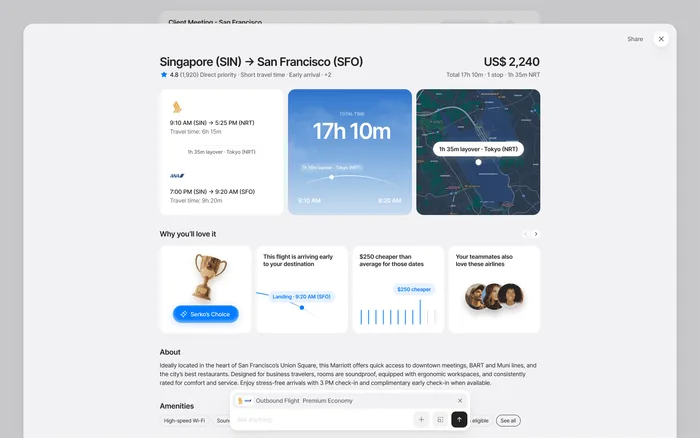
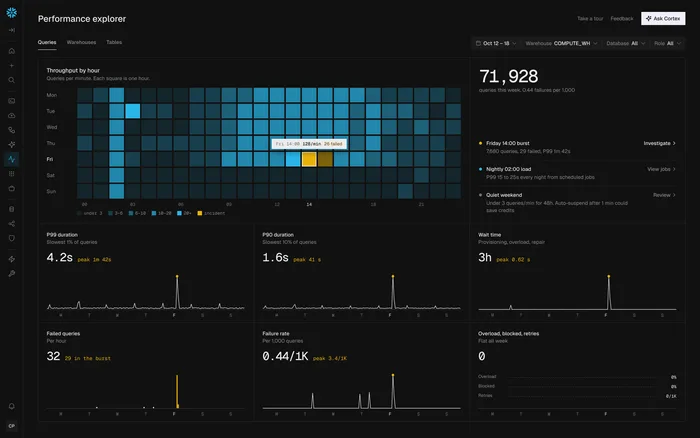
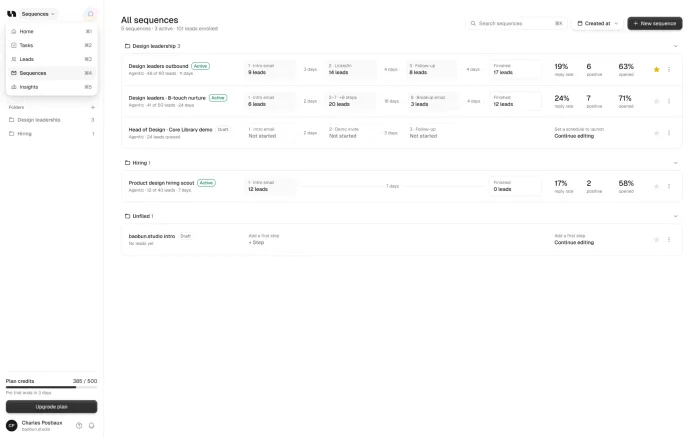

Start from the one question the dashboard answers for each user, put the answer first, and cut everything that doesn’t help them act on it. Group what’s left, pick charts that match the data, design the empty and loading states, and test it with real users before you build.
Our take: Most dashboards don’t need more charts. They need someone to decide what matters, and to remove the rest.
TL;DR
Start
Write down who opens the dashboard, and the one question they need answered.
Cut
Remove or move what nobody acts on, then put the answer first.
Chart
Lines for trends, bars for parts, plain numbers for single values.
Finish
Design the empty, loading and error states, and test with real data.
Start with the question
A dashboard answers one question, not every question. Before you touch a screen, write down who opens it and what they need to know in the first five seconds: “Are we on track this month?” or “What needs my attention?”
Everything on the screen should help answer that. If you have two very different kinds of users, they probably have different questions, and that’s a sign they need different views.
A founder
Are we on track this month?
An operator
What needs my attention today?
A client
Is my money well spent?
Cut before you design
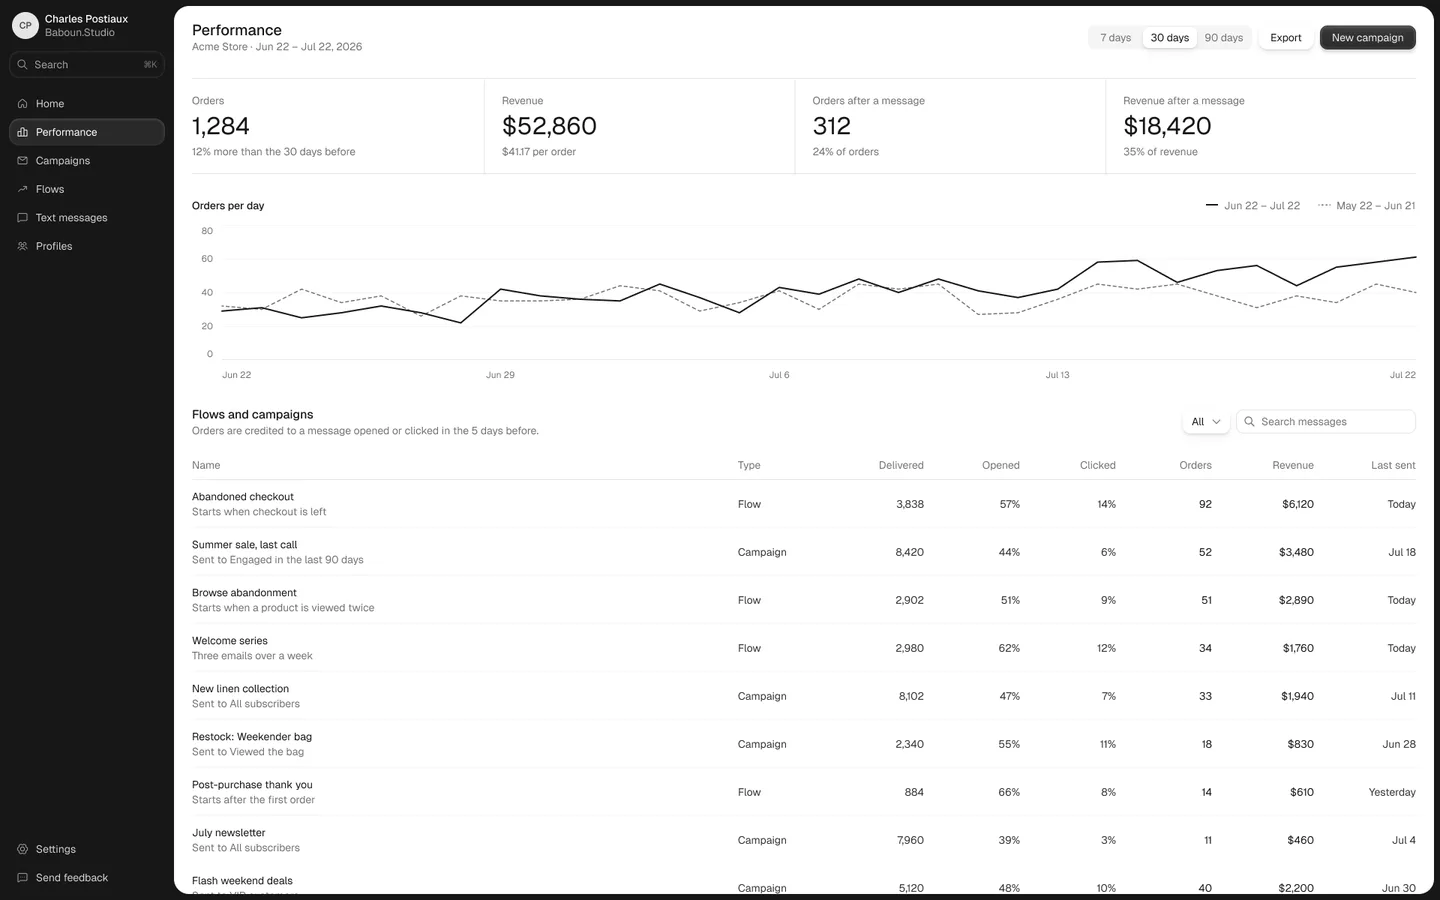
List every number and chart on the screen, and who uses each one. This is usually the most useful hour of the whole project, because you’ll find things nobody acts on. Move those to a detail page, or remove them.
Then put the answer to the main question at the top, large. Group what’s left by the decision it supports, not by where the data comes from.
Choose charts that match the data
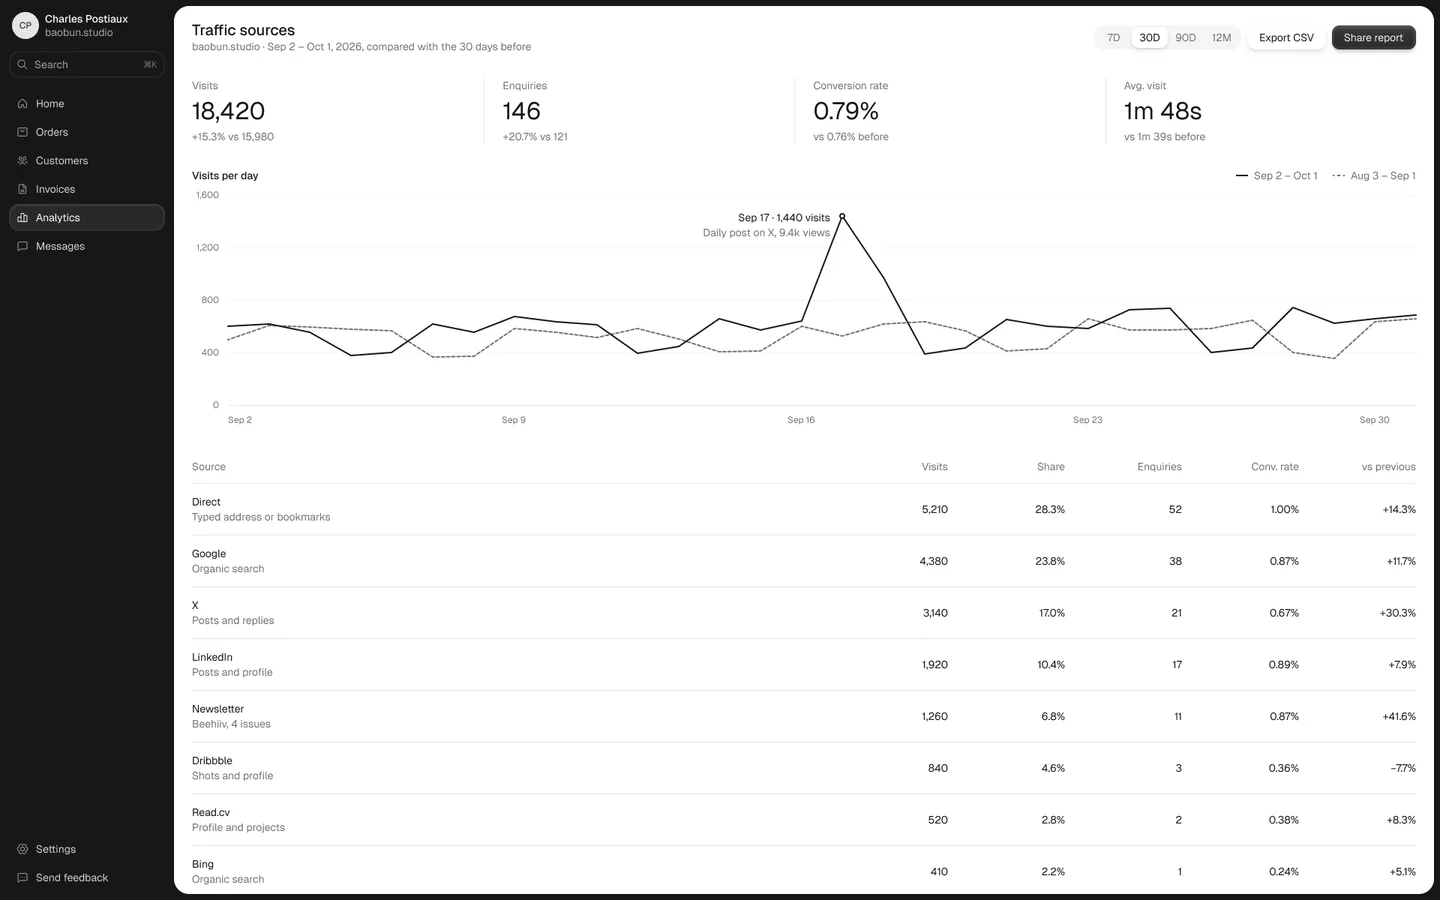
Show trends as lines, parts as bars and single values as plain numbers. Give every number a comparison, because “$42,000” means little until people can see if it’s up or down.
Use color only when it means something, and keep the meaning the same across the screen. Ten charts of equal weight leave people with nothing to look at first.
Design more than the full state
The version with perfect data is the one that gets designed, and the one new users never see. Design the empty, loading and error states too. An empty dashboard should tell a new user what to do next.
Then test a prototype with real users and real data before anyone builds it. Fake, perfect numbers hide the problems that real ones show.
Full
The version everyone designs first.
Empty
A new user’s first look, with a next step.
Loading
The frame first, then the data.
Error
What went wrong, and what to do.
If you want it done for you
Our dashboard redesign takes one screen of your product and redesigns it in 48 hours, for $1,000. You get a Figma file, PNGs and a live prototype, and the price counts as credit toward a larger project.
Which chart for which data
Most dashboard charts are chosen by habit. Start from what the number needs to show, and the right mark is usually obvious.
Loading and speed
A dashboard people check every day has to feel fast. Nielsen Norman Group’s long-standing limits are a useful guide: about one second before people’s flow of thought is interrupted, and about ten seconds before you lose their attention.
So show the frame and the key numbers first, and let slower charts fill in after. And always tell people what’s still loading, so the screen never looks broken.
When a dashboard needs more than a redesign
Sometimes the screen isn’t the real problem. If people export everything to a spreadsheet, the dashboard may be missing a filter or a view they need. If nobody opens it at all, it may be answering a question nobody has.
Before you redesign, ask a few users what they do right after they look at it. If the honest answer is “nothing”, change what it shows before you change how it looks. A cleaner version of the wrong data won’t help anyone, however good the charts are.
Roles matter here too. An executive and an operator rarely need the same numbers, so one screen for both often serves neither. Two simple views usually beat one crowded one.
Sources